The science behind NovaLife360.
Your real health story is written in your blood.
Biomarkers
We start with a comprehensive blood test that looks at dozens of key markers inside your body.
We’ve narrowed it down to the most essential 34 biomarkers chosen to give you a complete, actionable snapshot of your health without unnecessary testing. This approach aligns with research behind DNAm PhenoAge (NIH study), which is a special measure of aging that looks at various health indicators. It helps predict not just how long you might live, but also how healthy your life will be.
The study showed that phenotypic measures like the ones we test can strongly predict outcomes such as all-cause mortality, cancer risk, Alzheimer’s disease, and physical functioning compared to other methods (especially compared to the chronological age we normally use). It also revealed that accelerated biological aging is linked to higher activation of pro-inflammatory pathways and reduced DNA repair and mitochondrial efficiency meaning that trending toward worse results over time in these 34 biomarkers will lead to a shorter lifespan and lower quality of life.
In simple terms:
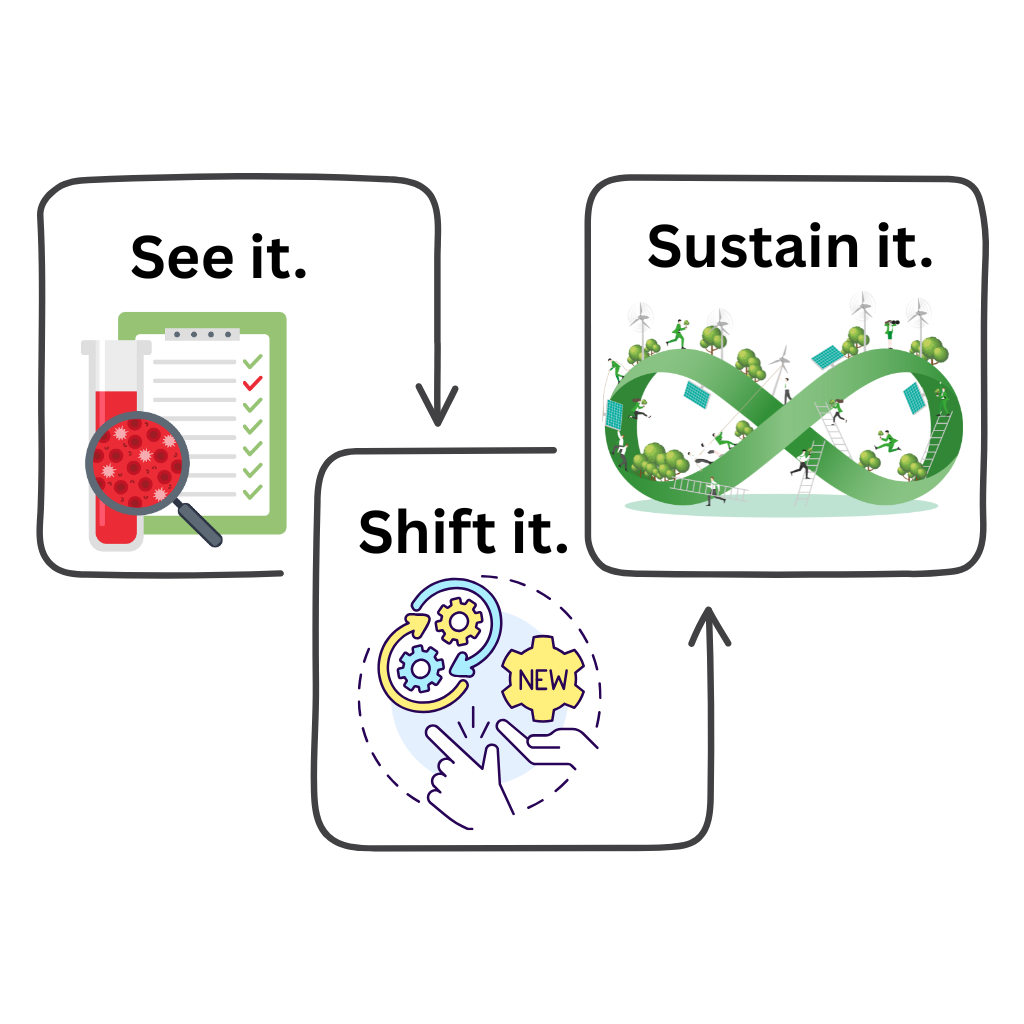
These biomarkers tell us where your health is today more accurately than other methods
They reveal how your body is trending
And they help us identify early, actionable changes to slow biological aging and increase and sustain your quality of life.
- Advantage 1: Cutting-edge technology
- Advantage 2: Intuitive user experience
- Advantage 3: Unmatched customer support
Biomarkers Measured
- hs-CRP
- Red Blood Cells
- Hemoglobin
- Hematocrit
- Mean Corpuscular Volume (MCV)
- Mean Corpuscular Hemoglobin (MCH)
- Mean Corpuscular Hemoglobin Concentration (MCHC)
- Red Cell Distribution Width (RDW)
- Platelets
- Mean Platelet Volume
- White Blood Cells
- Neutrophils
- Lymphocytes
- Monocytes
- Eosinophils
- Basophils
- Glucose
- Calcium
- Total Protein
- Alanine Aminotransferase (ALT)
- Aspartate Aminotransferase (AST)
- Alkaline Phosphatase (ALP)
- Bilirubin
- Blood Urea Nitrogen (BUN)
- Creatinine
- Albumin
- Carbon Dioxide
- Chloride
- Potassium
- Sodium
- Globulin, Calculated
- Albumin/Globulin Ratio
- BUN/Creatinine Ratio
- Estimated Glomerular Filtration Rate (eGFR)
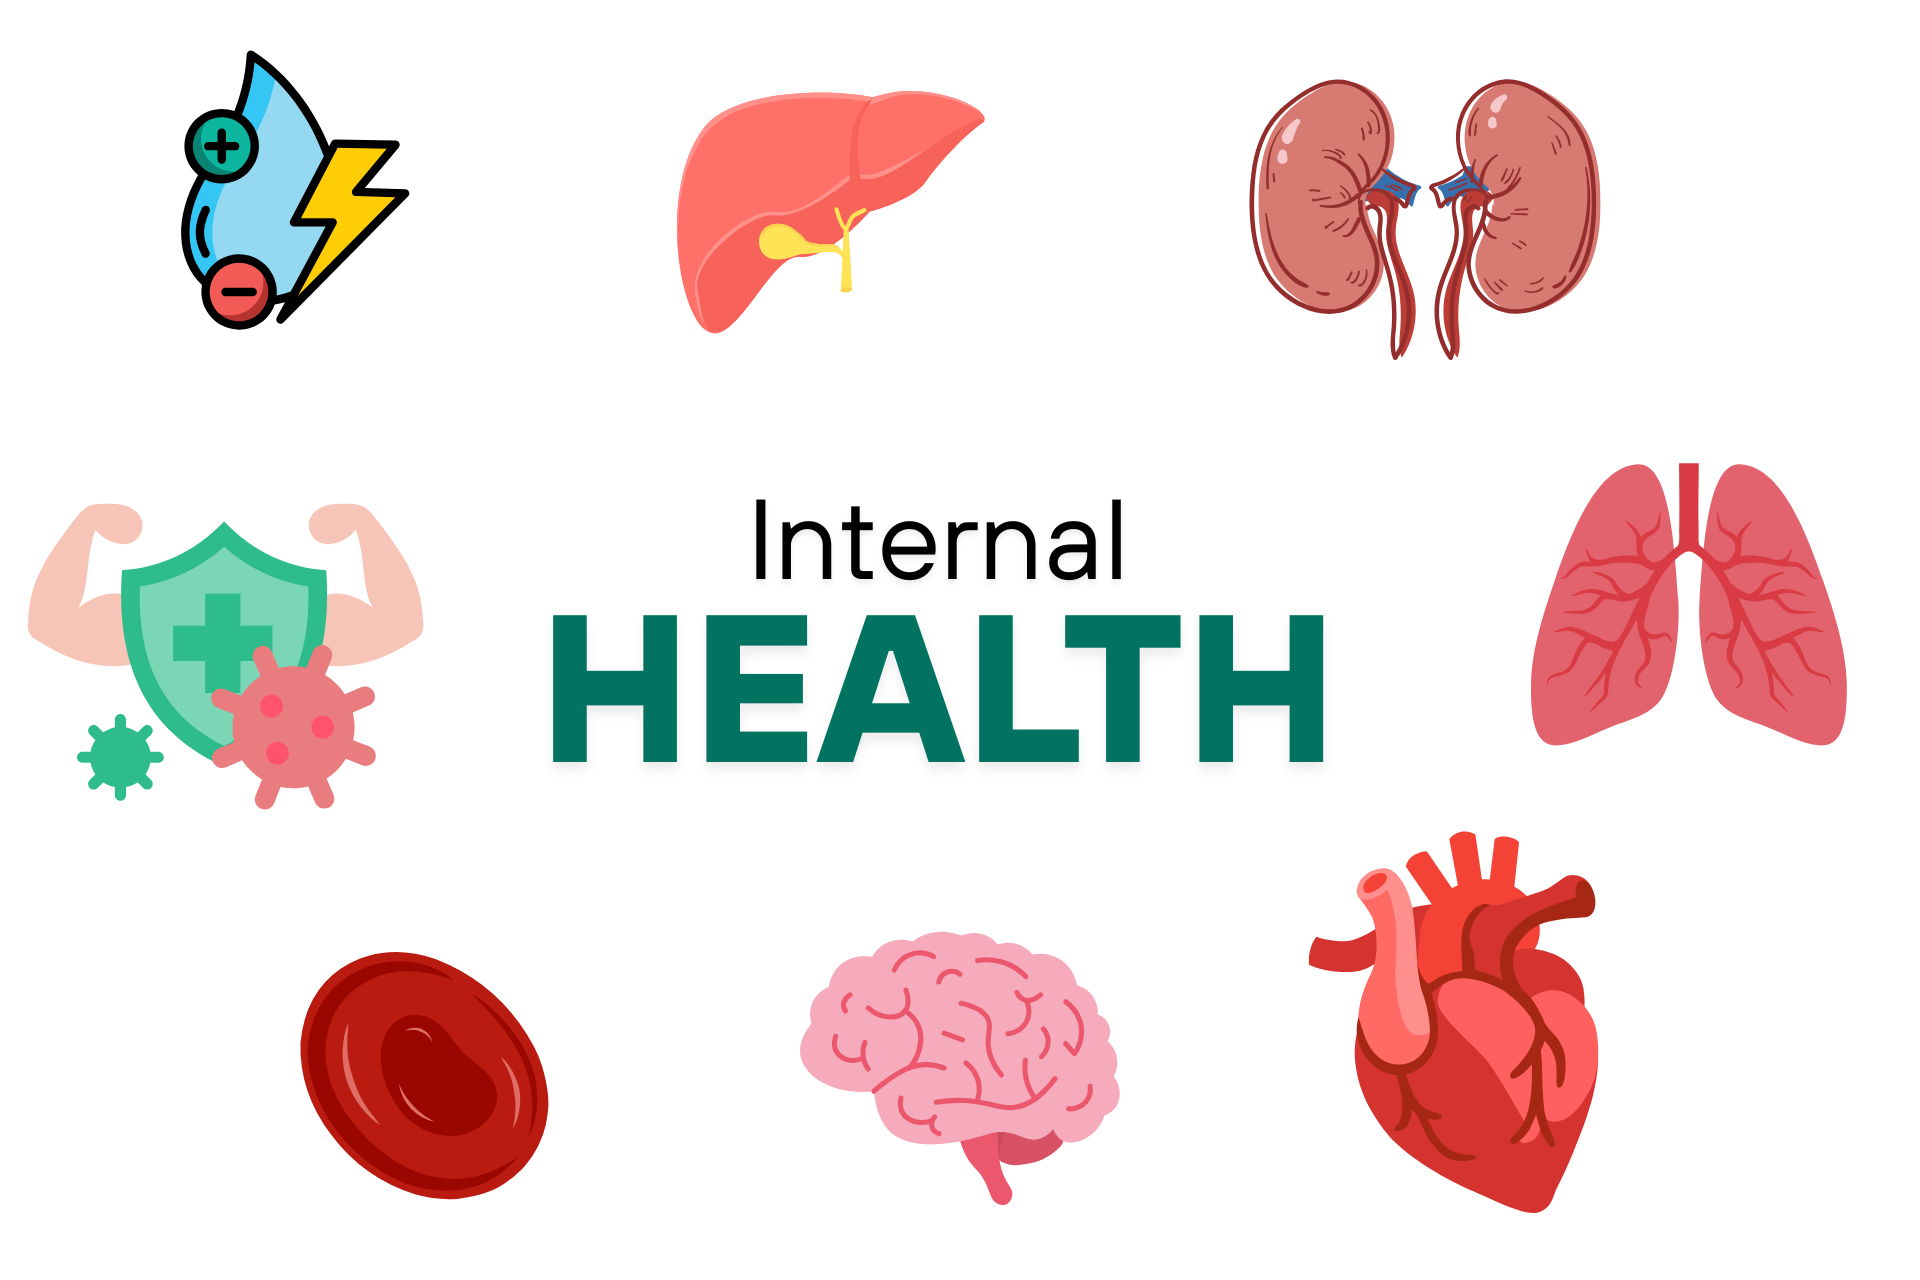
Why It Matters
These 34 biomarkers provide a 360° view of your health, covering inflammation, blood health, immune function, metabolic status, and organ performance. By analyzing these markers, we can identify trends, detect early warning signs, and create a roadmap for your health journey.
Inflammation (hs-CRP)
Biomarkers: hs-CRP
Inflammation is like a slow-burning fire in the body. A little is normal, but too much for too long increases your risk for heart disease, diabetes, and fatigue. High-sensitivity C-reactive protein (hs-CRP) is a powerful marker of inflammation with wide-ranging health implications produced by the liver. Elevated hs-CRP levels are strongly associated with an increased risk of:
Elevated hs-CRP levels are strongly associated with an increased risk of:
Cardiovascular Disease:
- Increased risk of heart attack and stroke: High hs-CRP levels are a strong predictor of cardiovascular events, even in individuals without prior heart disease.
- Atherosclerosis: Elevated hs-CRP can signal the presence and progression of plaque buildup in arteries.
- Prediction value: hs-CRP helps assess the likelihood of future cardiovascular events and can guide prevention strategies.
Other Inflammatory Conditions:
- Rheumatoid arthritis & autoimmune diseases: hs-CRP is used to monitor inflammation levels.
- Chronic inflammation: Persistent elevation can indicate underlying inflammation linked to multiple chronic diseases including cancer.
Metabolic syndrome & diabetes: High hs-CRP often accompanies these conditions, reinforcing the inflammation–metabolism connection.
It’s important to note that while hs-CRP is a marker—not necessarily a cause—of disease, its predictive value is well established. Genetics, lifestyle, and underlying health issues can all influence individual levels.
Additionally, a large-scale prospective cohort study, The Role of High-Sensitivity C-Reactive Protein in Activities of Daily Living Among Middle-Aged and Older Adults (MDPI), followed 16,342 participants over the age of 50. During that time, 4,579 participants developed disabilities in activities of daily living (ADL)—basic self-care tasks like dressing, cooking, or walking without assistance.
The study found that those with the highest hs-CRP levels had a 25% higher risk of developing ADL disability compared to those with the lowest levels—an effect that could realistically range anywhere between 14% and 36% increased risk (95% CI: 1.14–1.36) even after adjusting for other health factors like ethnicity, age, sex, smoking & drinking status, depression, chronic health issues, and more. The link was especially strong in people under 65 and those with a BMI ≥ 30 kg/m².
Despite its proven predictive value, hs-CRP is rarely tested in routine annual checkups, meaning many people have no idea they are at elevated risk until more serious issues appear.
hs-CRP has many more negative effects on the body, one study of 6,293 participants even linked it to depression (although its relationship is definitely more nuanced, high levels of hs-CRP is likely a factor), so it is critical to monitor its level in the body.
Why It Matters: Monitoring hs-CRP helps us catch silent inflammation before it contributes to serious health issues, enabling proactive lifestyle or medical adjustments. Letting you prevent serious complications before they become a problem. It can also help you proactively lower the risk of losing independence over time.
- Cardiovascular Disease
- Increased risk of heart attack and stroke
- Atherosclerosis
- Prognostic value
- Post-event
Blood & Oxygen Health
Biomarkers: Red Blood Cells, Hemoglobin, Hematocrit, Mean Corpuscular Volume (MCV), Mean Corpuscular Hemoglobin (MCH), Mean Corpuscular Hemoglobin Concentration (MCHC), Red Cell Distribution Width (RDW)
Your red blood cells carry oxygen to every part of your body. If they’re too low, too high, or the wrong size/shape, it can leave you feeling tired, foggy, or weak.
These biomarkers assess:
- Red Blood Cells, Hemoglobin, Hematocrit: Quantity and oxygen-carrying capacity.
- MCV, MCH, MCHC: Size and hemoglobin content of red blood cells, indicating potential nutritional deficiencies (e.g., iron, B12) or anemia.
- RDW: Variation in red blood cell size, which can signal early issues like anemia or chronic disease.
Abnormal levels are linked to increased risk for cardiovascular disease, stroke, and all-cause mortality. Very high or low RBC, Hb, and Hct are associated with vascular dysfunction, while abnormal MCV can indicate B12/folate deficiency or predict worse heart outcomes. Low MCHC is linked to poor cardiovascular prognosis, and high RDW is a strong, independent predictor of mortality—even in people without anemia. Maintaining these measures in optimal ranges supports energy, cognitive function, immunity, and longevity.
Why It Matters: Abnormalities in these markers can reveal conditions like anemia, dehydration, or bone marrow issues. Interventions to optimize these measures can profoundly improve quality of life and lifespan.
Elevated hs-CRP levels are strongly associated with an increased risk of:
- Cardiovascular Disease
- Increased risk of heart attack and stroke
- Atherosclerosis
- Prognostic value
- Post-event
Clotting & Repair
Biomarkers: Platelets, Mean Platelet Volume
Platelets help your body stop bleeding and repair damage. Platelets measure the number of clotting cells, while Mean Platelet Volume indicates their size, reflecting bone marrow activity. Too few platelets can lead to prolonged bleeding, while too many increase the risk of clots, potentially causing strokes or heart attacks.
Why It Matters: These markers ensure your body’s repair system is balanced, preventing complications from excessive bleeding or clotting.
Elevated hs-CRP levels are strongly associated with an increased risk of:
- Cardiovascular Disease
- Increased risk of heart attack and stroke
- Atherosclerosis
- Prognostic value
- Post-event
Immune System
Biomarkers: White Blood Cells, Neutrophils, Lymphocytes, Monocytes, Eosinophils, Basophils
These are your body’s defense team. Each type of white blood cell has a specific role:
- White Blood Cells (WBC): Overall count reflects immune system activity.
- Neutrophils: Fight bacterial infections.
- Lymphocytes: Manage viral infections and long-term immunity.
- Monocytes: Clear debris and fight chronic infections.
- Eosinophils: Address allergies and parasitic infections.
- Basophils: Involved in allergic responses.
Abnormal levels can indicate infections, allergies, autoimmune disorders, or hematologic conditions.
Why It Matters: These markers reveal whether your immune system is overworked, underperforming, or balanced, helping identify infections or chronic immune issues early.
Elevated hs-CRP levels are strongly associated with an increased risk of:
- Cardiovascular Disease
- Increased risk of heart attack and stroke
- Atherosclerosis
- Prognostic value
- Post-event
Metabolic & Organ Health
Biomarkers: Glucose, Calcium, Total Protein, Alanine Aminotransferase (ALT), Aspartate Aminotransferase (AST), Alkaline Phosphatase (ALP), Bilirubin, Blood Urea Nitrogen (BUN), Creatinine, Albumin, Carbon Dioxide, Chloride, Potassium, Sodium, Globulin, Calculated, Albumin/Globulin Ratio, BUN/Creatinine Ratio, Estimated Glomerular Filtration Rate (eGFR)
This group assesses critical metabolic and organ functions:
- Glucose: Indicates blood sugar control, flagging diabetes or hypoglycemia risk.
- Liver Markers (ALT, AST, ALP, Bilirubin, Albumin, Total Protein, Globulin, Albumin/Globulin Ratio): Evaluate liver function, toxin processing, and protein synthesis. Abnormalities may suggest liver disease, malnutrition, or chronic illness.
- Kidney Markers (BUN, Creatinine, eGFR, BUN/Creatinine Ratio): Assess kidney filtration and waste removal. Declining eGFR or abnormal ratios can indicate kidney stress or failure.
- Electrolytes (Calcium, Chloride, Potassium, Sodium, Carbon Dioxide): Maintain heart, muscle, and nerve function. Imbalances can affect energy, heart rhythm, or hydration.
- Proteins & Ratios (Albumin, Globulin, Albumin/Globulin Ratio): Reflect tissue repair, immune function, and nutritional status.
These biomarkers track how well your body regulates energy, processes nutrients, removes toxins, and maintains fluid and electrolyte balance. Glucose levels that remain high—even within the upper-normal range—are linked to increased risk of type 2 diabetes, cardiovascular disease, cognitive decline, and reduced lifespan. Conversely, stable blood sugar is associated with better energy, physical function, and longevity.
Liver function markers (ALT, AST, ALP, bilirubin, albumin, total protein) not only detect liver disease but also predict mortality. Elevated ALT and AST are linked to higher all-cause and cardiovascular death rates, while low albumin strongly predicts poorer outcomes in older adults, reflecting malnutrition, systemic inflammation, or chronic illness.
Kidney function biomarkers (BUN, creatinine, eGFR) are powerful predictors of healthy lifespan. Even mildly reduced eGFR is associated with higher mortality risk, cardiovascular events, and loss of functional independence.
Electrolytes such as sodium, potassium, calcium, and chloride are vital for nerve, muscle, and heart function. Imbalances—even slight—are linked to longer hospital stays, arrhythmias, cognitive decline, and higher mortality risk in older adults.
Maintaining optimal ranges for these markers supports energy, cognitive clarity, immune balance, and long-term organ health—key drivers of quality of life, disease prevention, and longevity.
Why It Matters: These markers provide insights into metabolic health, organ function, and nutrient balance. Trends in these values can catch issues like diabetes, liver dysfunction, or kidney disease early, allowing preventive action.
Elevated hs-CRP levels are strongly associated with an increased risk of:
- Cardiovascular Disease
- Increased risk of heart attack and stroke
- Atherosclerosis
- Prognostic value
- Post-event
Premium testing options
GlycanAge (Immune Age Test in Premium Plans)
Analyses 27 glycans (which represent over 99% of the glycan structures)
Your immune system tells a powerful story about how your body is aging—sometimes years before symptoms show up.
- Based on research from over 200,000 people
- Glycans (sugar molecules attached to proteins) change 7–10 years before disease is diagnosed
- Glycans respond rapidly to lifestyle changes, making them a powerful feedback tool
By understanding your immune age, you can act early to prevent chronic conditions and track the real impact of your health changes.
Science Behind GlycanAge Testing:
Glycans are complex sugar molecules that attach to proteins, such as immunoglobulin G (IgG), through a process called glycosylation. This process modifies protein function and plays a critical role in regulating immune responses, inflammation, and cellular communication. The GlycanAge Immune Age Test analyzes the N-glycosylation patterns of IgG, which serve as a biomarker of biological age and health status.
- Biological Age Indicator: Unlike chronological age, biological age reflects the body’s physiological state. IgG N-glycosylation profiles change with age and health, with specific glycan structures linked to inflammation, immune suppression, or disease progression. For example, reduced galactosylation or increased fucosylation of IgG is associated with conditions like rheumatoid arthritis or cardiovascular disease, as noted in studies from 1999 and 2024.
- Predictive Power: Research, such as the 2023 study in Biotechnology Advances (Shkunnikova et al.), demonstrates that IgG glycans can predict disease risk and therapeutic outcomes, acting as early warning signals for conditions like diabetes, cancer, or neurodegenerative diseases.
- Dynamic Feedback: Glycans are highly responsive to environmental and lifestyle factors. For instance, a 2023 study in Glycoconjugate Journal (Šimunić-Briški et al.) found that moderate exercise reduces the inflammatory potential of IgG glycans, lowering the GlycanAge index, which reflects a younger biological age.
The science behind GlycanAge has been researched deeply with 70+ publications from 1991 to 2024.
Elevated hs-CRP levels are strongly associated with an increased risk of:
- Cardiovascular Disease
- Increased risk of heart attack and stroke
- Atherosclerosis
- Prognostic value
- Post-event
TruMe TruAge Epigenetic Test (Optional Add-On)
TruAge uses advanced DNA methylation analysis to give you a detailed look at how your lifestyle is shaping your biology—and how to point it in a healthier direction. While it’s not the most exhaustive aging test available, it’s a highly valuable compass for spotting trends and seeing whether your changes are moving you forward or holding you back.
Research shows that the majority of aging is driven by lifestyle, not genetics—meaning your daily choices matter far more than you might think. TruMe TruAge gives you a simple, repeatable way to measure your progress and course-correct along the way.
At-home saliva testing that’s painless and easy to repeat anytime
Actionable insights to guide better habits and extend your healthspan
Grounded in peer-reviewed epigenetic research
Why Epigenetics Matters:
Your genes are the blueprint, but epigenetics is the control panel—switching certain genes on or off through chemical tags. These changes happen long before symptoms appear, making them one of the clearest early indicators of aging speed and health risks.
TruMe TruAge is not as accurate as other methods but it is a great marker to know if you’re heading in the right direction, test new lifestyle strategies, and steadily move toward a longer, stronger life.
Elevated hs-CRP levels are strongly associated with an increased risk of:
- Cardiovascular Disease
- Increased risk of heart attack and stroke
- Atherosclerosis
- Prognostic value
- Post-event
Connecting the Dots
These tests don’t just say “you’re in range” or “you’re not”—they show trends. For example, if your kidney function was fine last year but has been slowly declining, we can catch it early and act before it becomes a problem.
And because health isn’t just physical, we also ask about your lifestyle, stress levels, schedule, and goals. Plus, you can also input other data like VO2 max, average HRV, resting heart rate, max heart rate, etc..
The result is a 360° view of your health that connects the dots—so you don’t just know where you are, but where you’re headed. By combining biomarker trends with lifestyle data, we can tailor recommendations to optimize your health trajectory.


Get a of Your Health
Inflammation (hs-CRP)
Elevated hs-CRP levels are strongly associated with an increased risk of:
- Cardiovascular Disease
- Increased risk of heart attack and stroke
- Atherosclerosis
- Prognostic value
- Post-event